Many of the modeling tools that public works agencies, disaster response organizations, and watershed managers use to predict the effects of flooding from major storms do not consider a detail that makes a major difference, according to new research: land elevation.
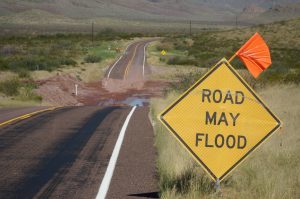
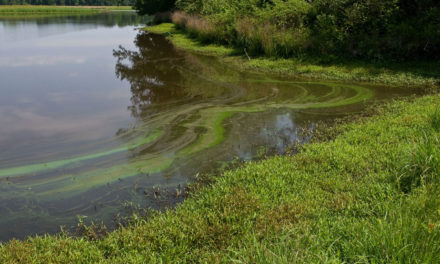
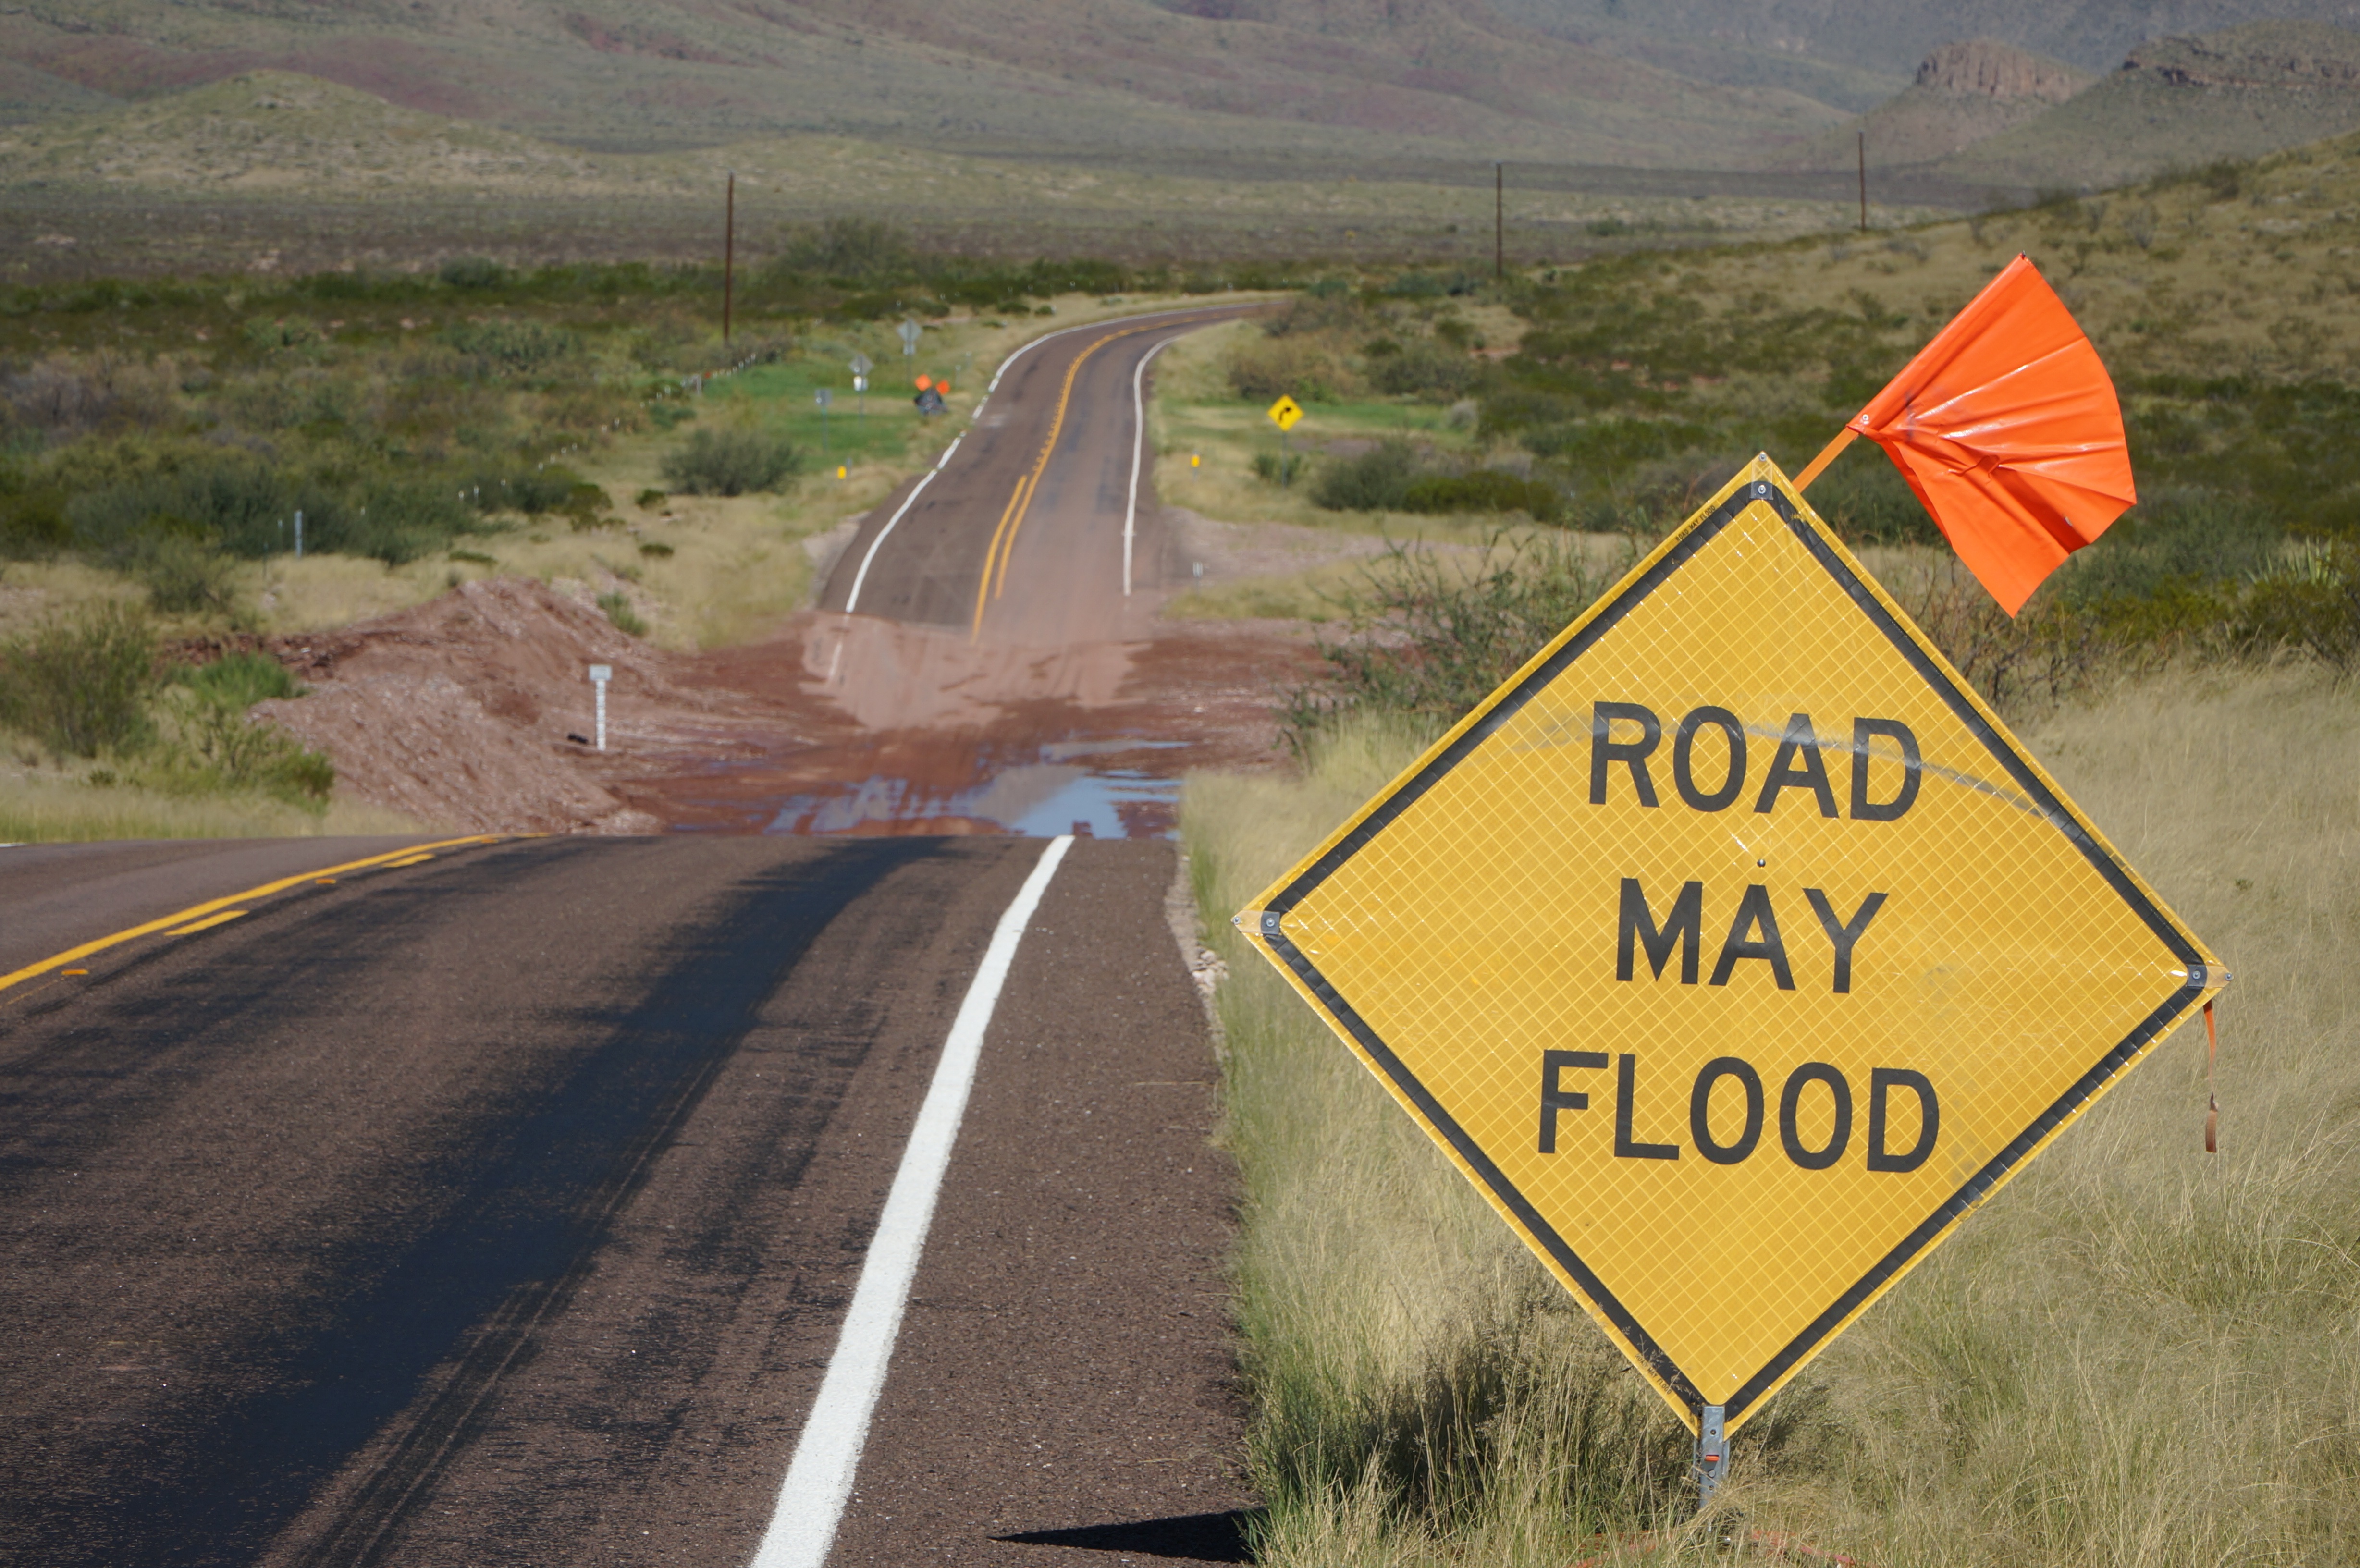
A new flood modeling tool developed by an international team of scientists considers how local topography can make even small increases in rainfall intensity much more likely to cause traffic disruptions. Photo courtesy of awsloley/Pixabay.
A study published in May in the journal Nature Communications describes a new flood-modeling tool that shows how such land features as hills and valleys affect the flow of stormwater runoff. By weaving together weather forecasts, topographical data, and roadway network maps, the research team’s computer model shows how even minor increases in localized rainfall can result in crippling traffic disruptions. The team behind the study consists of scientists from Rensselaer Polytechnic Institute (RPI; Troy, N.Y.), Boston (Mass.) University, and Beijing Normal University (China).
“To prepare for climate change, we have to know where flooding leads to the biggest disruptions in transportation routes. Network science typically points to the biggest interactions, or the most heavily traveled routes. That’s not what we see here,” said Jianxi Gao, an RPI computer scientist and lead author of the study, in a release. “A little bit of flood-induced damage can cause abrupt, widespread failures.”
Different thresholds for different topographies
Hurricane Florence made landfall in coastal North Carolina on Sept. 14, 2018. Over 3 days, the storm brought a record-breaking 913 mm (36 in.) of rain to parts of the state, or about 304 mm/d (12 in./d), according to figures from the U.S. National Oceanic and Atmospheric Administration.
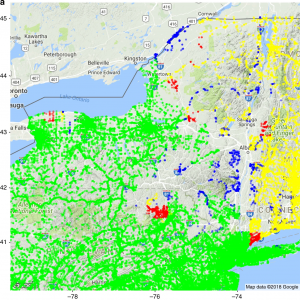
According to the model, a slight increase in storm intensity from 40 mm/d (1.5 in./d) to 45 mm/d (1.7 in./d) would abruptly knock out many of eastern New York state’s major roadways. In this figure, blue dots indicate roadways incapacitated by 40-mm/d (1.5 in./d) storms; red dots indicate roadways incapacitated by 45-mm/d (1.7 in./d) storms; and yellow dots indicate roadways that would remain unflooded, but become inaccessible under a 45-mm/d (1.7 in./d) storm. Photo courtesy of the researchers.
A storm bringing about 40 mm/d (1.5 in./d) of rain to topographically diverse New York would be unlikely to cause traffic disruptions beyond scattered road closures near the feet of the Adirondack and Catskill Mountains, according to the new model. But if a storm delivering 45 mm/d (1.7 in./d) of rain — only about 1/6 of Florence’s intensity — were to occur in New York, the model predicts that a domino effect would make the difference in transportation effects far more severe. Major intersections along the state’s eastern border would become untraversable, cutting off access to Connecticut, Massachusetts, New Hampshire, and western parts of New York. Effectively, northeastern New York state would become an island.
The team reports similar results in Florida, where an increase in storm intensity from 30 mm/d (1.2 in.) to 35 mm/d (1.4 in.) could abruptly incapacitate up to 50% of the statewide road network. On a larger scale, the model predicts that a storm affecting mainland China would reach a tipping point at 165 mm/d (6.5 in./d), knocking out about 17% of the nation’s roadways and isolating areas near the Tibetan Plateau.
Validating the model
To confirm the model’s traffic impairment predictions, the researchers simulated a storm identical to Hurricane Harvey, one of the costliest and most destructive storms in U.S. history, over the Houston, Texas area. Drawing on archived data from the University of Colorado’s (Boulder) Dartmouth Flood Observatory and news reports announcing road closures during the storm, the model accurately predicted 90.6% of reported road closures and 94.1% of reported street floods, according to the study.
“Hurricane Harvey caused some of the most extensive road outages in U.S. history, and our model predicted that damage,” Gao said in the release. “Adding 3-D information causes more unusual failure patterns than we expected, but now we have developed the mathematical equations to predict those patterns.”
Read the team’s full, open-access study in Nature Communications.