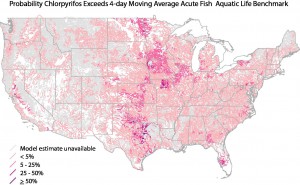
The online mapper can show the spatial variability of more than 100 pesticides. This map shows the prevalence of the insecticide chlorpyrifos based on 2012 data. Image by USGS
On Sept. 16, the U.S. Geological Survey (USGS) released a new interactive mapping tool that provides predicted concentrations for 108 pesticides in streams and rivers across the United States. The tool enables users to identify which streams are most likely to exceed water-quality guidelines for human health or aquatic life. The predictions also can be used to design cost-effective monitoring programs.
“Because pesticide monitoring is very expensive, we cannot afford to directly measure pesticides in all streams and rivers,” said William Werkeiser, USGS associate director for water. “This model can be used to estimate pesticide levels at unmonitored locations to provide a national assessment of pesticide occurrence.”
The online mapping tool is based on a USGS statistical model — referred to as Watershed Regression for Pesticides, or WARP ― that provides key statistics for thousands of streams. The WARP model estimates concentrations using information on the physical and chemical properties of pesticides, agricultural pesticide use, soil characteristics, hydrology, and climate.