Chemicals from fertilizers, animal wastes, and other land sources that enter coastal waterways through stormwater runoff represent the world’s most prevalent source of nutrient pollution. However, a new global model suggests that wastewater discharges — treated or untreated — collectively contribute a much larger fraction of total nutrient pollution to oceans than previously understood.
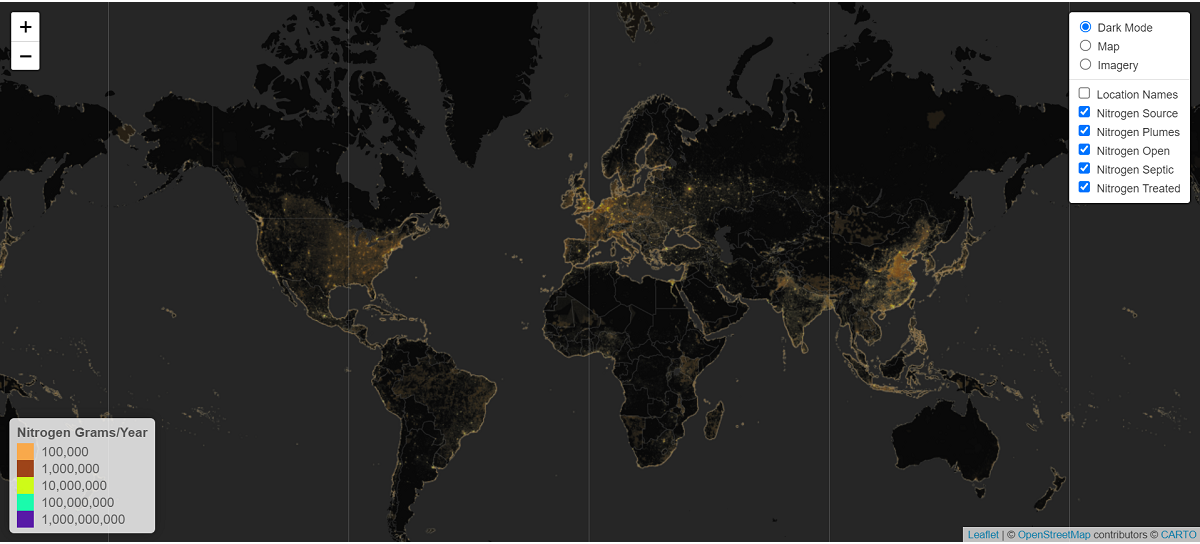
The free, high-resolution model, which estimates land-based nitrogen contributions throughout approximately 130,000 watersheds around the world, suggests that wastewater-based nitrogen discharges are highly concentrated by geography and population density. It illustrates, however, that excess nitrogen from these hotspots tends to travel long distances, affecting nearly every watershed on Earth.
“We estimate that 25 watersheds contribute approximately 46% of global nitrogen inputs from wastewater into the ocean,” said Cascade Tuholske, lead author of a study about the model recently published in the journal PLoS ONE. Tuholske, now a postdoctoral researcher with Columbia University, led this research as a graduate student at the University of California Santa Barbara.
Discharge Diagnostics
According to the model, wastewater discharges add about 6.2 trillion grams of nitrogen to coastal waters each year. About twice as much comes from agricultural runoff each year.
About 5% of nitrogen contributions from wastewater originate from septic systems in remote or unsewered communities, while about 32% of nitrogen comes from untreated wastewater directly inputted from combined sewer overflows, open defecation, or similar sources. The most prevalent source of nitrogen originating from wastewater — counter to conventional wisdom — is treated effluent discharged from water resource recovery facilities (WRRFs), the study describes.
Part of the reason, according to the researchers, is that managing nutrients in municipal wastewater typically requires very different strategies and process investments than managing pathogens. While many WRRFs have the means to implement technology that strikes a balance between managing nutrients and managing pathogens, many other facilities must prioritize one over the other, and choose to address pathogen risks more comprehensively to protect public health.
Accounting for the treatment capabilities of WRRFs worldwide, all of which feature different technology and treatment efficiencies, posed a challenge while developing the model, its developers describe. Nitrogen removal rates at WRRFs generally range from about 10% to about 90%. Based on this variability, the model assumes that all WRRFs remove an average 55% of nitrogen. However, the model also incorporates data from a 2017 World Health Organization/UNICEF report assessing drinking water, sanitation, and hygiene infrastructure to assign weights to nitrogen removal in each watershed. The model uses this process to highlight specific watersheds thought to contribute the most nitrogen to waterways through wastewater, finding watersheds in India, Korea, and China to be the largest contributors. The Yangtze River watershed in northern China alone is thought to contribute about 11% of global nitrogen from wastewater, according to the model.
Information Benefits Collaboration
Tuholske described that the model provides a starting point to spur collaboration on nutrient issues between stormwater professionals, wastewater professionals, and other watershed stakeholders.
The ability to visualize, at 1-km (0.6-mi) resolution, specific points that contribute high, surface-level nitrogen concentrations to coastal waters could help stormwater infrastructure managers prioritize areas for local runoff control interventions. By extension, understanding a coastal area’s exposure to traveling nitrogen plumes from other regions could provide necessary information to plan mitigation measures.
Notably, understanding the finer points of how local WRRFs function could help stormwater organizations make decisions that improve both the environment and public health. Tuholske outlined an example in Santa Barbara, California, in which the model found nitrogen and pathogen contributions from WRRF effluent to be low, but that pathogen occurrence in coastal waters tends to surge after heavy storms, according to locally collected data. He suspects, based on data from the model, that the culprit may be improper management of discharges from local septic systems, which adequately remove excess nitrogen but may lack capabilities to sufficiently treat pathogens.
“Santa Barbara, to me, is emblematic of the problem of wastewater input to oceans worldwide – a lack of coordination to solve the problem,” Tuholske said. “But stormwater professionals can work with marine ecologists and public officials to design more holistic solutions, including green infrastructure. I actually think there is great potential to create synergies.”
Using the model to inform green infrastructure design and placement could represent an important resource for integrated planning, the study describes.
Explore the new model here, and read the full, open-access study, “Mapping global inputs and impacts from of human sewage in coastal ecosystems,” in the journal PLoS ONE.
Top image courtesy of the researchers

ABOUT THE AUTHOR
Justin Jacques is editor of Stormwater Report and a staff member of the Water Environment Federation (WEF). In addition to writing for WEF’s online publications, he also contributes to Water Environment & Technology magazine. Contact him at jjacques@wef.org.