A new, free-to-use mapping tool enables users to pinpoint flood-prone areas nearly anywhere on Earth. The tool, created by researchers from the United Nations University Institute for Water, Environment, and Health (UNU-INWEH; Hamilton, Ontario) with assistance from Google (Mountain View, California), Mapbox (San Francisco), McMaster University (Hamilton, Ontario), and other partners, can provide up to 40 years of flooding data at a street-by-street resolution of just 30 m (100 ft).
Historical data on flooding is one of the stormwater sector’s most crucial resources. In everything from infrastructure design to disaster response to land-use zoning, effective decision-making often depends on knowing where, when, and how severely floods occur within a community. However, the tools, expertise, and expense associated with gathering and functionalizing historical flooding data often hamper planning efforts in remote or under-resourced communities. Lacking robust and actionable information about their community’s flooding weak points, locals may face greater risks for loss of property or life during severe flood events.
The new World Flood Mapping Tool will be particularly useful in these communities, explained UNU-INWEH Director Vladimir Smakhtin. At no cost to users, it can provide reliable, ongoing information about flooding patterns as they change.
“Floods in the past decade have impacted the lives of more than half a billion people, mainly in low- and middle-income countries, and resulted in damages of nearly $500 billion USD – roughly equal to the GDP of Singapore. More recent floods worldwide have added to a fast-growing toll of upended lives, damage, and deaths,” Smakhtin said in a release. “We need to prepare now for more intense and frequent floods due to climate change and hope this tool will help developing nations in particular to see and mitigate the risks more clearly.”
From Insight to Action
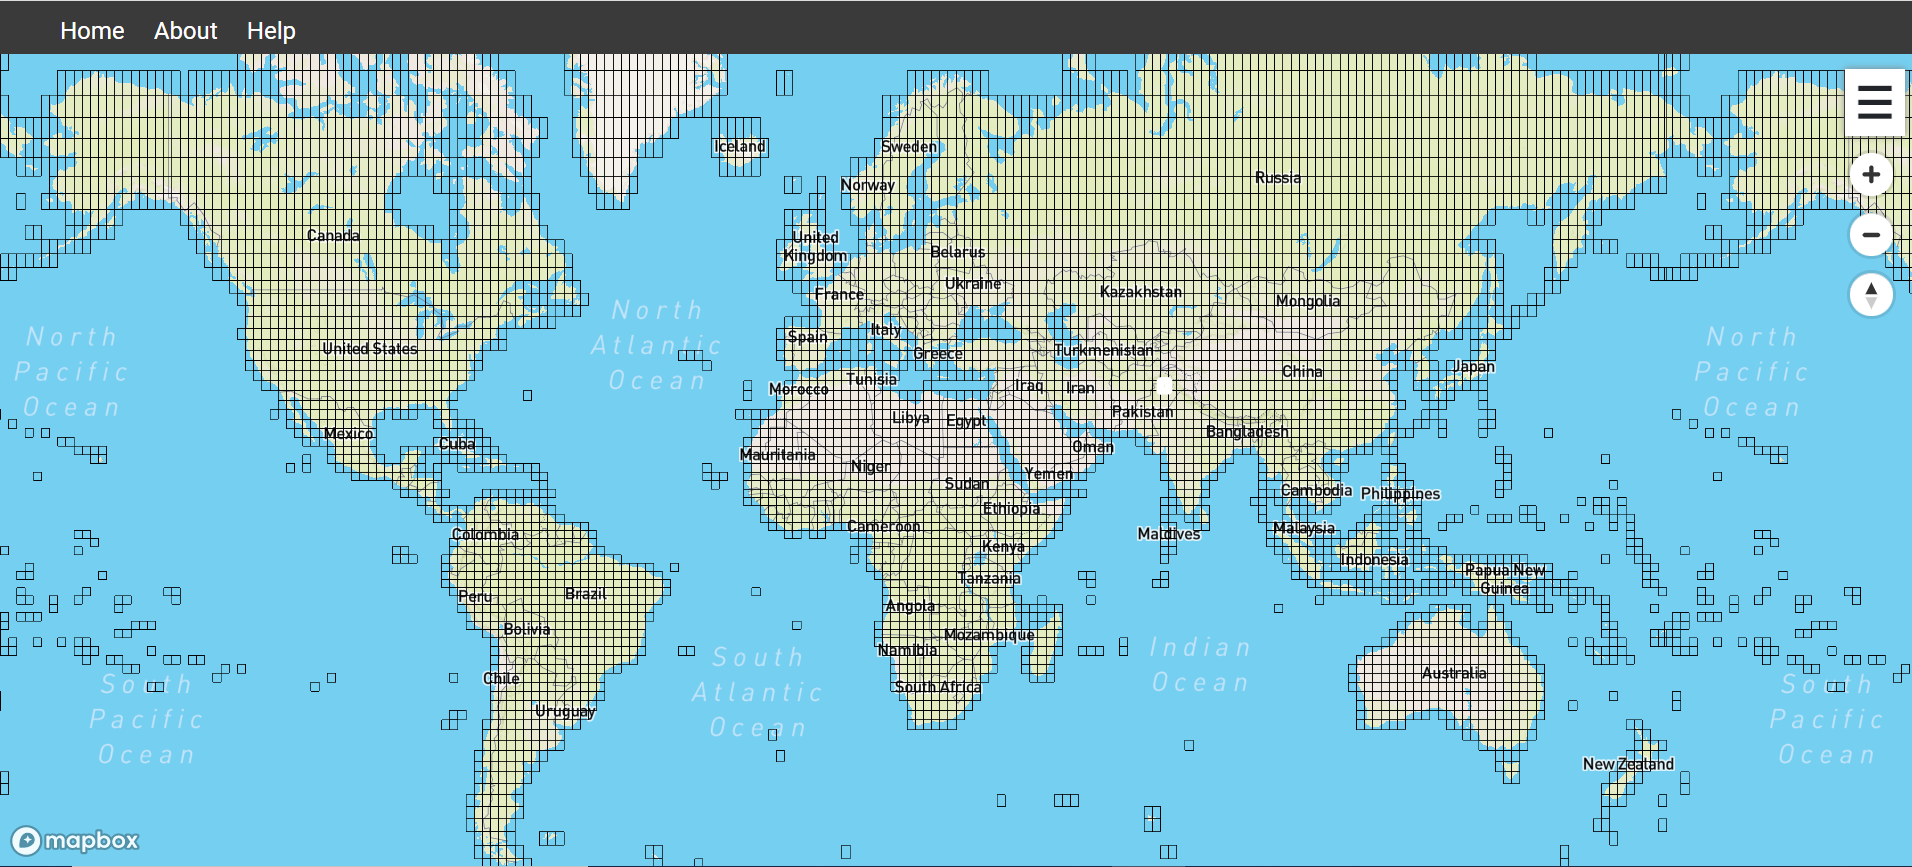
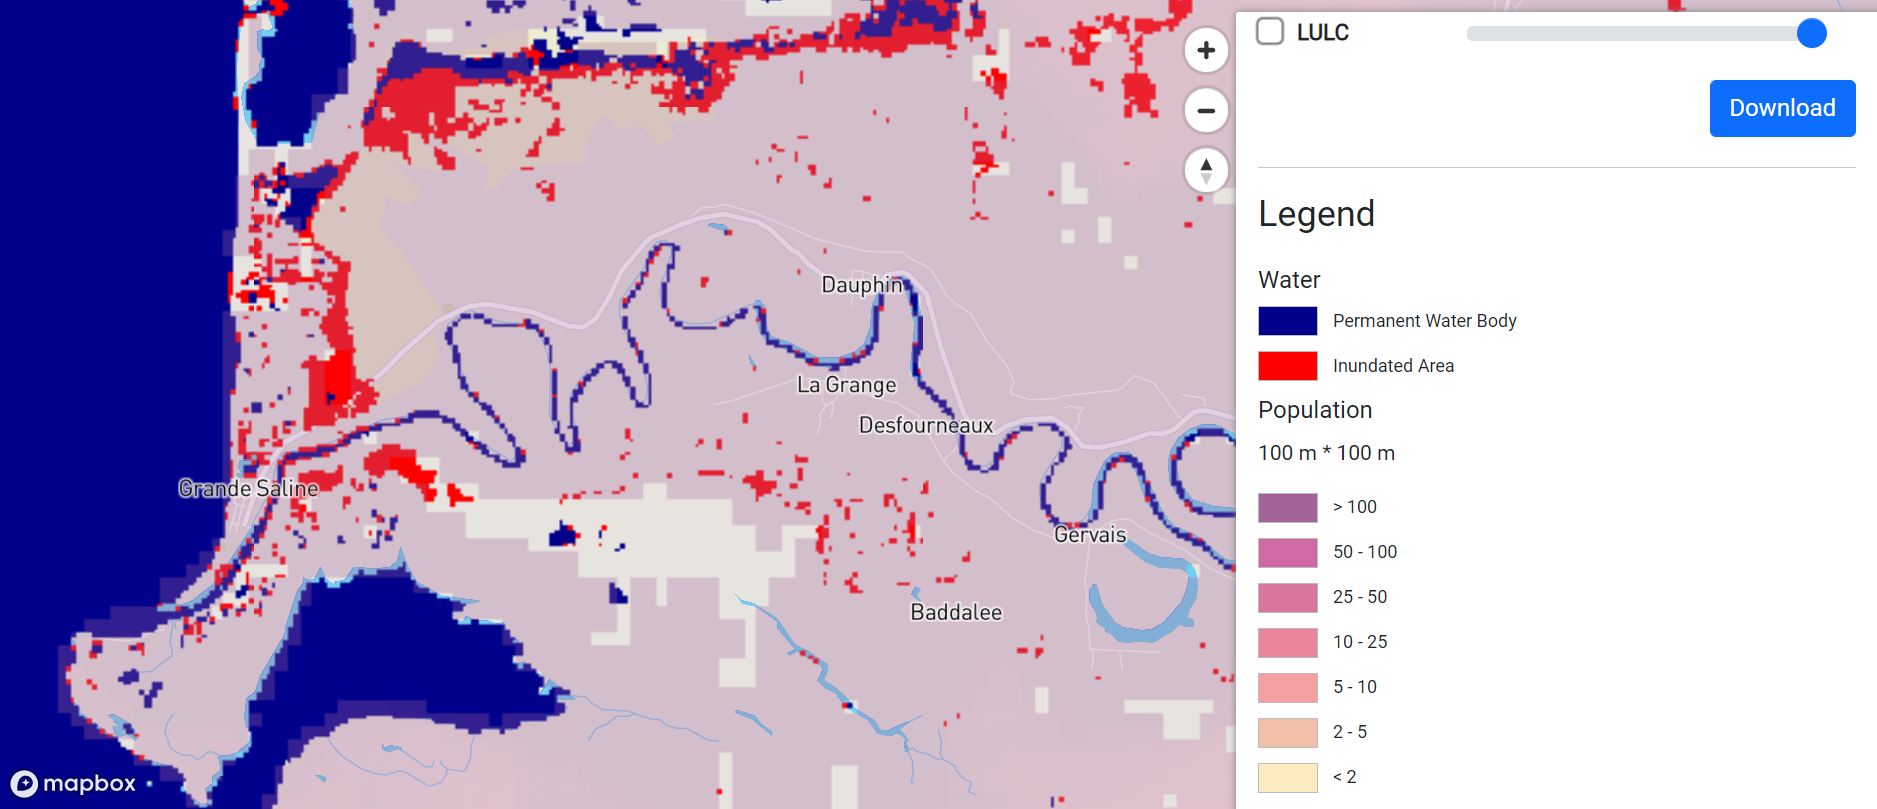
Users begin by selecting a country of interest, of which more than 170 are currently supported by the tool. They can refine their search area to particular regions and time periods, which will instantly generate color-coded maps that detail which parts of the study area experienced temporary or permanent water coverage during the specified span of time. Additionally, the tool can enhance the flooding map with integrated data on population density, land use, elevation, and building coverage to identify factors that may affect flood risk and severity.
Key to the tool’s functionality are decades of data from the Landsat Program, a satellite-based land-monitoring project jointly operated by the U.S. National Aeronautics and Space Administration (NASA) and U.S. Geological Survey (USGS). While the agencies make this data freely available, the tool functionalizes flood-history information by using the Google Earth Engine to enhance its interactivity and enable users to visualize its implications.
Because the tool works from continuously updated datasets, its capabilities also will update automatically in response to new floods that occur, according to the developers, a particularly important feature as climate change continues to drive more frequent and intense storms.
“As temperatures continue to rise, the number of flood events will increase along with their severity,” said Hamid Mehmood, a UNU-INWEH remote-sensing specialist who led the tool’s development, in a release. “No place is immune. And yet remarkably few regions, even in wealthy countries, have useful, up-to-date flood maps because of the cost and difficulty of creating them.”
The development team validated the World Flood Mapping Tool by mapping a series of well-documented flood events that occurred in eight countries between 2008 and 2019. Maps rendered within seconds by the tool achieved an average accuracy of 82% compared to actual accounts of each flood’s effects and extent, according to the developers.
Designed for Versatility
Potential applications for the tool reach well beyond the stormwater sector, described UNU-INWEH surface water specialist Duminda Perera.
In addition to aiding infrastructure planning and disaster readiness, the tool’s insights could also be of use to logisticians and supply chain managers to pre-emptively identify threats to the movement of goods and people. A commercial adaptation of the tool already in the works by the development team is expected to facilitate flood-risk assessments for the insurance industry, while another off-shoot will focus more narrowly on planning for the future effects of climate change.
The World Resources Institute (Washington, D.C.) projects that urban areas will grow by as much as 80% within the next decade in many parts of the developing world. A resource like the World Flood Mapping Tool will be especially useful for city planners on the forefront of this development, developers say, to determine where and where not to build. However, the high resolution of the tool also lends itself to productive use by urban planners around the world.
“Painting a detailed picture of the historical and potential flood risk areas will be invaluable for any urban and regional planning department,” Perera said in a release.
Explore the World Flood Mapping Tool at the UNU-INWEH website.
Top image courtesy of PIRO4D/Pixabay

ABOUT THE AUTHOR
Justin Jacques is editor of Stormwater Report and a staff member of the Water Environment Federation (WEF). In addition to writing for WEF’s online publications, he also contributes to Water Environment & Technology magazine. Contact him at jjacques@wef.org.