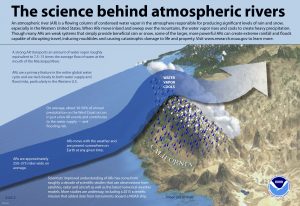
Atmospheric rivers (ARs) are long strands of highly condensed water vapor in the atmosphere that form over oceans and move inland. When ARs contact mountains in the western U.S., the system suddenly cools, forcing the water vapor out of the atmosphere as rain or snow. These AR storms are thought to be responsible for up to 50% of all annual precipitation in West Coast states. U.S. National Oceanic and Atmospheric Administration.
Atmospheric rivers (ARs) are a newly understood phenomenon, officially defined by the American Meteorological Society (AMS; Boston) just 2 years ago. ARs – narrow, fast-moving bands of highly concentrated atmospheric water vapor that commonly stretch hundreds of miles in length – often result in severe rain or snow storms when that vapor makes landfall.
On the West Coast of the U.S., AR storms can be a mixed blessing. Much like hurricanes, larger and slower AR systems can cause serious flooding and severe damage. However, in a region that routinely struggles with drought, smaller AR storms are a welcome way to keep stressed reservoirs brimming.
A team of university and government meteorologists led by the University of California, San Diego (UCSD; La Jolla) and the U.S. National Weather Service (NWS; Silver Spring, Md.) have developed a new scale to more accurately study AR storms and their effects.
Balancing water supply benefits with flood risks
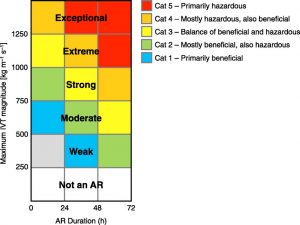
The scale proposes a methodology for grouping AR storms based on how much water vapor they carry and how long a storm affects a specific area. The amount of water vapor is expressed as a value known as integrated vapor transport (IVT), and the duration is a measure of movement speed.

Unlike most extreme weather events, light AR storms can provide welcome relief to stressed reservoirs and aquifers along the West Coast of the U.S. A new scale to predict and measure AR storm effects developed by academic and government meteorologists provides a forecast about each event’s positive effects in addition to its negative effects. Creative Commons.
Whereas scales that describe similar events like hurricanes or tornadoes designate categories based only on the potential damages the event might cause, the AR scale also conveys the potential water supply benefits that minor AR storms could bring.
According to Jonathan Rutz, an NWS meteorologist and one of the scale’s developers, municipalities, scientists, and emergency responders can use the scale as a tool to help plan water supply management and disaster relief efforts before experiencing the brunt of the storm.
“Forecasters in the western U.S. have been using the concept of ARs in their forecasting for a few years now, and many have been looking for a way to distinguish beneficial from hazardous AR storms,” Rutz said in a release. “The scale was designed partly to meet this need, and it is anticipated that it will be used extensively.”
Categories defined by the AR storm scale, which does not yet have a formal name, are as follows:
- weak (category 1), which are primarily beneficial, with IVT values between 250 and 500 kg m-1 s-1;
- moderate (category 2), which are more beneficial than hazardous, with IVT values between 500 and 750 kg m-1 s-1;
- strong (category 3), which are equally beneficial and hazardous, with IVT values between 750 and 1000 kg m-1 s-1;
- extreme (category 4), which are more hazardous than beneficial, with IVT values between 1000 and 1250 kg m-1 s-1; and
- exceptional (category 5), which are primarily hazardous, with IVT values greater than 1250 kg m-1 s-1.
Additionally, AR storms that last less than 24 hours are demoted by one category, and AR storms that last more than 48 hours are promoted by one category, according to an article about the scale that appeared in the Bulletin of the American Meteorological Society.
To put this in perspective, consider a coastal AR storm that affected parts of California in February 2017. It lasted about 24 hours and produced only modest rainfall. This storm would be considered ‘weak’ according to the scale, the researchers write. On the other end of the spectrum, a historically destructive AR storm drenched Central California from December 1996 into January 1997. This storm caused extreme flooding and more than $1 billion in damages. This storm would be considered ‘exceptional’.
Both necessary and dangerous
The scale will provide crucial information to researchers at the UCSD Center for Western Water and Weather Extremes (CW3E) that analyzes an array of weather data to provide seasonal precipitation outlooks and frequent short-term forecasts, said F. Martin Ralph, CW3E director. Ralph is another of the scale’s developers.
Under the new AR scale, AR storms are rated between 1 and 5 based on the amount of water vapor they carry and the time they spend over a given geographical location. Unlike similar scales that measure hurricanes or tornadoes, these ratings convey the potential benefits of AR storms as well as their hazards. Photo courtesy of the researchers.
These predictions are especially useful for West Coast communities. ARs form with particular frequency over the Pacific Ocean, and when they reach inland mountain ranges are forced upward into cooler parts of the atmosphere. The sudden temperature shift causes massive amounts of water vapor in the AR to fall as rain or snow.
According to a previous UCSD analysis, as much as 50% of California’s total annual precipitation could originate from AR storms, making them a major determinant for the state’s water supplies. In February 2019 alone, CW3E recorded six AR storms over the western U.S. – one reaching Category 4, or ‘extreme,’ status.
“The top 5% wettest days each year, most of which are attributable to ARs, are responsible for 85% of the interannual variability in precipitation over Northern California,” the researchers write. “Therefore, the presence or absence of a few AR events can ‘make or break’ precipitation over the course of the water year.”
As average global ocean temperatures continue to warm, scientists expect AR storms to become more prevalent not only in the western U.S., but in tropical, coastal areas around the world. Several scientific organizations including the U.S. National Aeronautics and Space Administration estimate that for each 1°C increase in ocean temperatures, the atmosphere can hold about 7% more water vapor.
Learn more about the AR scale in the Bulletin of the American Meteorological Society.