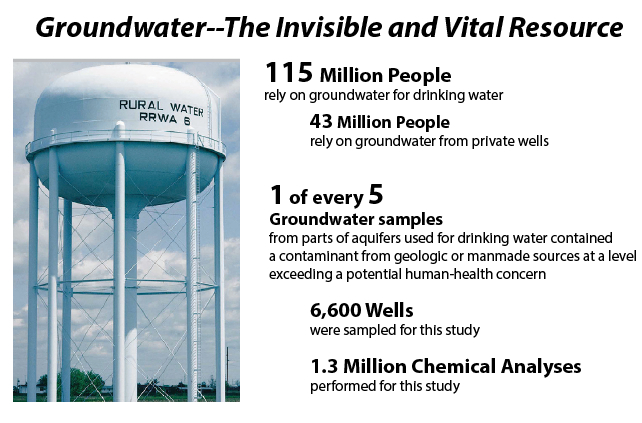
An infographic by USGS on its recent national summary report on the quality of the U.S. groundwater
The U.S. Geological Survey (USGS) recently completed and made available online its national summary report on the quality of the U.S. groundwater — an assessment of 6,600 wells. Groundwater provides drinking water for about 115 million people, or more than a third of the nation. Yet 22% of groundwater samples contained at least one contaminant in concentrations of potential human health concern. Additionally, over-pumping to meet increasing water demands has in many areas profoundly changed groundwater flow and quality. Read more.
Now the agency also is releasing new tools for analyzing groundwater and surface water hydrologic data. A visual interface helps shed light on water availability and hydrologic trends in response to climate and land-use changes and watershed variability.
On Jan. 22, USGS released the Groundwater (GW) Toolbox. The GIS-driven graphical and mapping interface is a significant advancement in USGS software for estimating base flow (the groundwater-discharge component of streamflow), surface runoff, and groundwater recharge from streamflow data.
The GW Toolbox brings together several analysis methods previously developed by the USGS and Bureau of Reclamation. Each of the methods included with the GW Toolbox use daily streamflow data automatically, retrieved from the USGS National Water Information System (NWIS) for more than 26,000 streamgage sites across the U.S. In addition to streamflow data, the GW Toolbox facilitates the retrieval of groundwater-level and precipitation time-series data from the NWIS database.